In today’s fast-paced manufacturing surroundings, teh ability to access real-time data and make informed decisions is more critical than ever. Ignition by Inductive Automation empowers manufacturers and plant managers to create customized operator dashboards that optimize operations, enhance productivity, and drive strategic initiatives.Wiht its robust suite of tools, Ignition allows users to tailor dashboards to meet specific operational needs, offering dynamic data visualization and seamless integration with existing systems. In this article, we will explore the strategic value of using Ignition to build custom operator dashboards, highlight common deployment pitfalls, and delve into advanced capabilities that can transform how your facility leverages data.
Consider the case of a large-scale beverage manufacturer that implemented Ignition to streamline their production floor operations. By developing customized operator dashboards, they were able to:
- Improve operational efficiency by displaying live OEE (Overall Equipment Effectiveness) metrics, allowing operators to identify and address bottlenecks in real time.
- Enhance decision-making thru intuitive visualizations, presenting key performance indicators and production data in a clear, actionable format.
- Facilitate seamless communication between departments by integrating with existing ERP systems, ensuring that data flows effortlessly throughout the organization.
As experts in Ignition deployment, Innorobix has helped numerous clients overcome the challenges of designing and implementing custom dashboards. From understanding user requirements to ensuring data security, our decades of experience enable us to deliver solutions that drive tangible results. In the following sections, we will provide expert insights into key features to leverage, such as drag-and-drop development environments, responsive design capabilities, and multi-platform accessibility, ensuring your operator dashboards are both powerful and user-friendly.
Design Principles for effective Operator Dashboards in Ignition
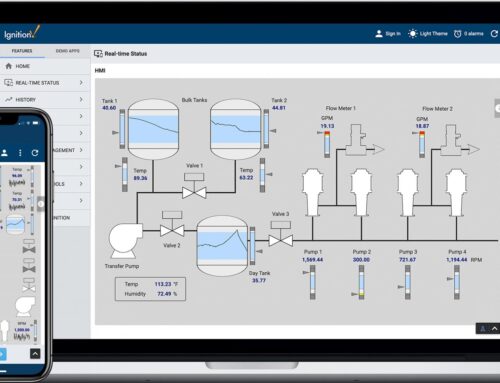
Creating operator dashboards in Ignition requires a meticulous approach to ensure that operators can interact effectively with the system. At the heart of this design strategy lies the principle of User-Centric Design. This involves prioritizing the needs and preferences of the operators who will be using the dashboard daily. First, identify the critical information that operators require for quick decision-making. Such as, a bottling plant might need real-time statistics on production rates, equipment status, and quality control metrics right at their fingertips. by customizing dashboards to emphasize these metrics, you reduce the time operators spend searching for crucial data, thereby enhancing efficiency.
Another design principle is Simplicity and Clarity. Overloading dashboards with excessive information can led to operator fatigue and increased error rates. To avoid this,emphasize key performance indicators using straightforward visuals like color-coded status indicators and trend graphs. In a recent deployment at a pharmaceutical manufacturing facility, simplifying the dashboard to highlight only critical alarms and production anomalies with vibrant color alerts considerably improved operator response times. Additionally, employing consistent navigation structures and intuitive controls fosters user confidence and reduces the learning curve. Key elements should be accessible within one to two clicks, allowing operators to seamlessly navigate through the dashboard without needless complexity.
Advanced Ignition Techniques for Customizing Dashboard Functionality
In the realm of Ignition, advanced techniques can significantly enhance dashboard functionality, allowing for a more personalized and efficient user experience. One critical feature to master is the use of Python scripting within Ignition’s scripting environment. This capability facilitates the creation of custom scripts to automate tasks,manipulate data,and interact with external systems. As an example,a manufacturing plant can develop a script that automatically triggers alerts when production metrics deviate from set thresholds. This not only improves responsiveness but also minimizes downtime. Additionally, scripts can be used to create dynamic, interactive components on dashboards, such as trend charts that adapt based on user inputs or real-time data feeds. By leveraging Python scripting, manufacturers can craft highly customized dashboards tailored to their specific operational needs.
Another advanced technique involves harnessing Ignition’s extensive library of APIs to create bespoke dashboard widgets that integrate seamlessly with existing systems. For example, consider a case where a beverage company needs to display real-time data from both modern PLCs and legacy equipment. By utilizing Ignition’s APIs, developers can write custom modules that fetch data from disparate sources, allowing operators to view comprehensive production information in a single dashboard. This approach also supports the configuration of complex logic directly within the dashboard, such as conditional formatting or multi-step process controls. By taking advantage of these APIs, manufacturers are able to design dashboards that not only present critical information but also offer intuitive controls tailored to specific processes. This flexibility and depth of customization ensure that operator dashboards are not only visually engaging but also functionally superior, enhancing overall productivity.
Integrating Real-Time Data and Analytics into Operator Dashboards
Incorporating real-time data analysis into Ignition-designed operator dashboards can revolutionize the way facilities manage processes. By visualizing live data streams from various production units,operators can swiftly identify issues,efficiently manage workflows,and make informed decisions. Consider a packaging plant leveraging real-time analytics to minimize downtime. By integrating sensors on conveyor belts with ignition’s data analytics capabilities, any anomalies such as bottlenecks or stoppages can be immediately detected. With this information readily available on custom dashboards, operators can swiftly deploy corrective measures and enhance operational efficiency. As a result, key performance metrics like Overall Equipment Effectiveness (OEE) can be optimized, leading to ample improvements in productivity.
When designing these dashboards, it is essential to focus on the clarity of visualization and the functionality of real-time data updates. Effective implementation requires:
- Prioritization of data points: highlight critical metrics such as temperature,speed,and pressure that impact safety and performance.
- Use of dynamic components: Utilize Ignition’s powerful scripting and data binding to offer interactive elements, such as trend graphs and real-time alerts.
- Customization to suit operational needs: Tailor dashboards to specific operational roles by providing customized views depending on the task at hand, improving user satisfaction and efficacy.
In the food processing industry,such as,real-time dashboards can track compliance metrics like production times and temperature control,ensuring adherence to regulatory requirements. By employing Ignition’s Perspective Module, these dashboards become accessible on any device, ensuring plant managers and operators remain informed regardless of their physical location.
Optimizing User Experience: Practical recommendations for Dashboard Layout and Navigation
Creating a user-centric dashboard with Ignition involves understanding the nuances of human-machine interaction and employing design principles that optimize user experience. A well-designed dashboard prioritizes clarity,ease of use,and accessibility. Start by organizing elements intuitively. group related information together to help operators quickly interpret data — such as, cluster temperature, pressure, and machine status indicators for a particular process in one section. This logical organization helps users focus on the most critical elements without distractions. Employ progressive disclosure by showing detailed data upon user interaction, such as click or hover events, which prevents clutter and promotes efficient navigation.
Consistent navigation serves as a cornerstone for user satisfaction in custom operator dashboards. Ensure that navigation elements are easily identifiable and predictable. Consider implementing a sidebar for primary navigation, allowing for quick access to frequently used sections.Use distinct icons and labels on navigation buttons, facilitating instant recognition — as a notable example, a wrench icon for maintenance sections or a chart icon for historical data analysis. Furthermore, leverage Ignition’s styling capabilities to customize themes and color-coding, enhancing usability. restrict the color palette to a limited set to avoid cognitive overload, using colors that align with ergonomic guidelines — such as green for safe statuses and red for alarms — to maintain consistency and improve real-time decision-making.
Q&A
Q1: What makes Ignition an ideal platform for building custom operator dashboards in industrial settings?
A1:
Ignition is favored for its versatility and performance, making it ideal for creating custom operator dashboards in industrial environments due to:
- Unified Platform: Combines SCADA, HMI, and IIoT capabilities in a single, powerful solution.
- Real-Time Monitoring: Provides live data insights that are crucial for timely decision-making and process optimization.
- Device Agnostic: Accessible from any device with a web browser, supporting mobile and remote operations seamlessly.
- Rapid Deployment: Accelerates development with its intuitive drag-and-drop designer and built-in components.
Example: A manufacturing company utilized Ignition to create dashboards that monitor machine efficiency across multiple production lines, resulting in a 25% increase in productivity.
Q2: How can ignition dashboards be adapted to meet specific operational needs?
A2:
Customization of Ignition dashboards is highly achievable through:
- Flexible Design Tools: Use the Vision or Perspective modules to create dashboards that cater to specific workflow requirements.
- Advanced Scripting: Leverage built-in Python scripting to implement custom logic and dynamic data interactions.
- User Preferences: Design dashboards to accommodate different user roles by displaying relevant information accordingly.
- Multilingual support: Implement interfaces that support multiple languages for global operations.
Advanced Tip: A pharmaceutical company customized its dashboards to provide operators with process-critical data in real time, significantly reducing batch processing errors.
Q3: What common challenges may arise during the deployment of Ignition dashboards, and how can they be mitigated?
A3:
Key challenges and mitigation strategies include:
- Complexity Overload: Keep designs user-friendly by prioritizing essential data to avoid operator overwhelm.
- Performance issues: Optimize data queries and reduce screen refresh rates to enhance performance.
- Insufficient Training: Implement comprehensive training programs to ensure operators maximize dashboard utility.
- Security considerations: Regularly update security protocols to guard against cybersecurity threats.
Expert Insight: A utility company encountered performance lag due to complex dashboard design. By simplifying data displays and optimizing database queries, they achieved smoother operations.
Q4: How easily can ignition dashboards integrate with existing plant systems and devices?
A4:
Ignition’s robust integration capabilities ensure smooth interfacing with existing systems:
- Protocol Compatibility: Supports protocols such as OPC UA and MQTT, enabling connectivity to a wide array of devices and PLCs.
- Database Connectivity: Seamlessly integrates with SQL databases for data acquisition and storage.
- Enterprise Integration: APIs and web services facilitate integration with ERP, MES, and other enterprise applications.
Example: A logistics company integrated Ignition dashboards with its transportation management system, allowing for real-time tracking of delivery statuses and enhancing logistics planning accuracy.
By addressing these questions, manufacturers can effectively evaluate and implement Ignition to develop bespoke operator dashboards that enhance operational performance. Innorobix, with its deep Ignition expertise, stands ready to assist you in designing and launching these advanced solutions tailored to your unique industrial needs.
Future Outlook
utilizing Ignition to build custom operator dashboards can significantly enhance operational efficiency and improve decision-making processes within manufacturing environments. By leveraging Ignition’s modular architecture,real-time data capabilities,and user-friendly design interface,manufacturers can create dashboards that are not only tailored to their unique operational needs but are also scalable and future-proof. Key takeaways from this exploration include:
- Customizability: ignition allows operators to design dashboards that fit specific use cases, thus providing actionable insights and streamlining workflows.
- Real-Time Data Integration: The ability to integrate seamlessly with various data sources ensures that operators have access to the most current and insightful data.
- Scalability: As operational needs grow, Ignition’s flexible framework can adapt to expanded requirements without extensive overhauls.
At Innorobix, we pride ourselves on being at the forefront of Ignition expertise, with decades of experience in the design, deployment, and ongoing support of Ignition solutions. Whether your looking to optimize existing systems or embark on a transformative journey with custom operator dashboards, our team is ready to assist. we invite you to explore tailored solutions with us or request a consultation/demo to see firsthand how our expertise can drive tangible benefits for your operations. Contact Innorobix today to take your plant’s operational excellence to the next level.