Boosting Efficiency with Real-Time OEE Dashboards for Food & Beverage Plants Using Ignition
in the competitive landscape of the food and beverage industry, operational efficiency is not just a goal but a necessity. Overall Equipment Effectiveness (OEE) is a crucial metric that offers a comprehensive view of a plant’s operational performance. by evaluating the availability, performance, and quality factors of machinery, OEE provides an objective basis for improving productivity. Incorporating real-time OEE dashboards significantly amplifies this potential, offering plant managers a clear and immediate insight into thier production processes.ignition by Inductive Automation serves as an advanced platform that allows seamless integration of real-time OEE dashboards into your plant’s operations. With its robust and flexible architecture, Ignition empowers food and beverage plants to enhance visibility and control across multiple processes. Here’s what makes real-time OEE dashboards indispensable and how Ignition can make a tangible difference:
- instantaneous Feedback: With real-time data, managers can quickly identify and address inefficiencies, significantly reducing downtime and bolstering throughput.
- Comprehensive Data Integration: ignition enables the collection and integration of data from diverse sources,creating a unified platform for comprehensive OEE analysis.
- Customizable Dashboards: Tailor dashboards according to specific operational needs, allowing for focused insights and targeted improvements.
- Improved Decision-Making: By leveraging real-time facts,managers can make informed decisions that boost operational efficiency and product quality.
- enhanced Traceability and Compliance: Maintain high standards of traceability and compliance, essential in the food and beverage sector, by continuously monitoring and recording equipment performance.
Through this article,we aim to provide an in-depth exploration of how real-time OEE dashboards,powered by Ignition,can transform food and beverage plants into more efficient,safer,and more traceable operations. Join us as we delve into the specific benefits, implementation strategies, and real-world examples that illustrate the powerful impact of OEE monitoring when paired with cutting-edge technology.
Understanding OEE: Key Components and Metrics for Food & Beverage Plants with Ignition
Understanding Overall Equipment Effectiveness (OEE) is fundamental for improving operational efficiency in food and beverage plants. OEE is comprised of three core components: Availability, Performance, and Quality. Each of these components plays a vital role in identifying bottlenecks and areas for improvement. As a notable example, if a food processing line is halted frequently, the Availability metric helps identify the downtimes. Performance evaluates whether equipment is operating optimally when it is indeed running, while Quality measures the proportion of products that meet quality standards without requiring rework. Utilizing Ignition,these metrics can be painstakingly tracked in real-time,allowing for immediate corrective actions and minimizing production losses. Ignition’s capability to integrate with various data sources ensures that no data—such as downtime,speed loss,or defect rates—is left unaccounted for.
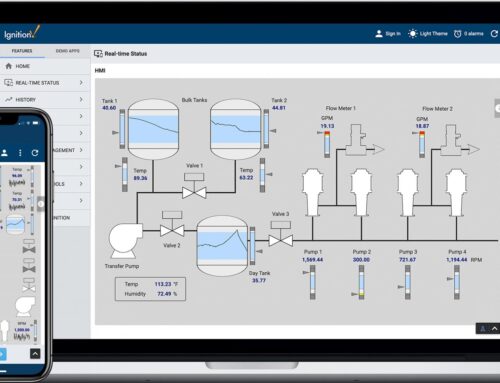
The implementation of Ignition for OEE tracking is enhanced by features like dynamic real-time dashboards which visually present these metrics to floor operators and management simultaneously. This centralized view fosters a proactive culture by enabling quick decisions based on current equipment performance. For example, a beverage plant using Ignition can set alerts for when OEE falls below a certain threshold, prompting maintenance teams to respond rapidly. these real-time insights help in maintaining high levels of efficiency and reducing the cost implications of unscheduled downtimes. With Ignition, plants also benefit from past data analysis, which aids in predictive maintenance scheduling and continuous improvement. As you deploy Ignition for OEE in your plant, consider customizing dashboards to highlight key metrics pertinent to your operations, thus ensuring your team is always informed and engaged.
Implementing Real-time Data Collection and Visualization to Enhance OEE
Implementing real-time data collection and visualization through Ignition dramatically transforms how food and beverage plants manage and enhance their Overall Equipment Effectiveness (OEE). With real-time dashboards,operators and plant managers watch live updates on machine performance,downtime,and production quality,allowing for instant feedback and decision-making. For example,consider a beverage plant that experiences frequent downtimes due to unanticipated equipment failures. By employing Ignition’s real-time data collection, they can set up alerts that notify the maintenance team of potential issues before they escalate, thus reducing unplanned downtimes.
Moreover, these dashboards provide diverse visual elements like graphs, charts, and trend lines that simplify complex datasets. This visualization helps identify inefficiencies, such as bottlenecks in the production line or variations in product quality.Imagine a bakery utilizing Ignition to track the yield rate of their production batches. With detailed visual insights, they notice that a specific oven runs inconsistently at peak times. By addressing this issue directly, they improve both throughput and product consistency. In essence, having access to real-time, actionable insights allows plants to fine-tune their operations, leading to enhanced productivity, improved product quality, and increased profitability.
Leveraging Ignitions Features for Accurate Downtime Tracking and Performance Analysis
Integrating Ignition into your food and beverage plant’s operations paves the way for superior downtime tracking and comprehensive performance analysis. By leveraging its data collection and visualization capabilities, managers can gain a detailed understanding of equipment status and process bottlenecks. With real-time data capture, any instance of downtime is immediately recorded, triggering alerts that minimize response times. This proactive tracking allows for precise calculation of metrics such as Mean Time Between Failures (MTBF) and Mean Time to Repair (MTTR), enabling maintenance teams to refine their strategies and improve overall equipment reliability.
Ignition’s intuitive dashboard capabilities provide critical insights at a glance, facilitating performance analysis through customizable displays. These dashboards can show various performance indicators, such as machine efficiency, idle times, and reasons for stoppages, which are crucial for a thorough Overall Equipment Effectiveness (OEE) evaluation. As a notable example,a beverage processing facility that routinely faces bottlenecks in its bottling line can utilize these insights to pinpoint specific stages responsible for inefficiencies.By deploying Ignition’s historical data analysis, operators can identify recurring issues and trends, thus informing strategic decisions to optimize workflows and enhance productivity holistically.
Best Practices for Designing User-Friendly OEE Dashboards: Recommendations and Examples
when designing user-friendly OEE dashboards for food and beverage plants using Ignition, several best practices can significantly enhance usability and effectiveness. First, prioritize clarity and simplicity in your design. Dashboards should convey actionable insights at a glance. Opt for easily interpretable visual elements such as bar graphs, line charts, and status indicators. Employ consistent colour schemes to denote various operational states—green for optimal performance, yellow for caution, and red for issues. As an example, a leading beverage company simplified their dashboard by using a single KPI per screen, complemented with drill-down options for further details, thereby reducing cognitive load and potential errors for operators.
Another vital consideration is interactivity and personalization. Effective OEE dashboards should not only display data but also allow users to interact with it for deeper insights. Incorporate features like hover-over tooltips, drill-down capabilities, and customizable views. users visiting the dashboard can choose which metrics are most relevant to their roles, whether it’s yield percentage, downtime analysis, or shift performance comparisons. An agricultural produce processing plant implemented role-specific dashboards, allowing operators, supervisors, and maintenance personnel to tailor the displayed data according to their specific needs, enhancing decision-making and response times across different levels of the institution.
The Conclusion
real-time OEE dashboards powered by Ignition offer transformative benefits for food and beverage plants, enhancing operational efficiency, and accuracy in performance monitoring. By leveraging Ignition’s robust capabilities, these dashboards provide actionable insights through intuitive data visualization, immediate feedback on production metrics, and seamless integration with existing systems. Key takeaways include:
- Timely Decision-Making: OEE dashboards provide up-to-the-minute data, enabling swift responses to operational challenges and opportunities.
- Enhanced Traceability: With detailed logging and analysis, improve product traceability, ensuring compliance with industry standards.
- Customized Solutions: Tailor dashboards to specific plant needs, offering flexibility and scalability as operations evolve.
- Reduction in Human Error: Automate manual processes and data entries, minimizing errors and maximizing productivity.
These capabilities not only drive efficiency but also establish a safer and more compliant production environment. For those ready to transform their operational oversight,Innorobix stands ready to assist. Explore our solutions further, or request a personalized consultation or demo to see how we can tailor OEE dashboards to meet your plant’s unique needs. Empower your facility’s performance with Innorobix and Ignition to lead in today’s competitive market.