Introduction:
in the competitive and fast-paced realms of manufacturing, staying ahead in operational efficiency and productivity is not just an advantage—it’s a necessity. For industries heavily reliant on press and mold operations, such as automotive, consumer goods, and advanced materials, the ability to monitor and respond to Key Performance Indicators (kpis) in real-time is paramount. Enter the age of Real-Time KPI Dashboards: a transformative tool that offers the precision tracking and empirical insights necessary for optimizing processes and enhancing productivity.
this article delves into the architecture and applications of Real-Time KPI Dashboards, focusing on their indispensable role in press and mold monitoring. By harnessing real-time data analytics,these dashboards provide manufacturers with the ability to:
- Monitor Operational Metrics: Keep a close eye on machinery performance metrics such as cycle times,injection pressure,and mold temperature.
- Predict Maintenance needs: Use predictive analytics to schedule routine maintenance,thus minimizing downtime and extending the lifecycle of critical equipment.
- Enhance Quality Control: Implement quality checkpoints directly within the workflow, identifying and mitigating defects before thay escalate.
- Optimize Energy Usage: Track energy consumption patterns to identify opportunities for cost savings and lasting practices.
For example, an automotive parts manufacturer might use a KPI dashboard to track the performance and wear of injection molds, ensuring that each part produced meets stringent quality standards while reducing waste and energy consumption.
In this comprehensive exploration, we will provide technical insights into the integration of KPI dashboards using advanced software solutions, discuss the data infrastructure required, and highlight the transformative potential these systems offer when leveraged in a manufacturing setting. By the end of this article, you will be equipped with a deeper understanding of how real-time monitoring and analytics can drive sustainable growth and operational excellence in the pressing and molding sectors.
Real-Time Data Acquisition and Integration Techniques for Enhanced Monitoring
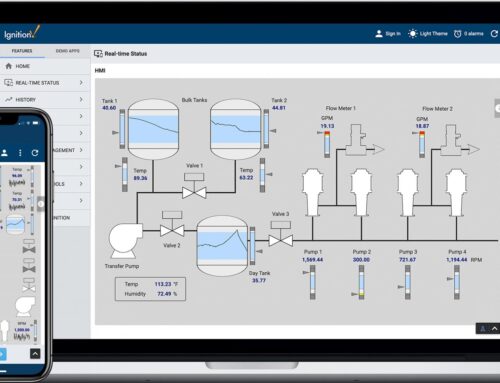
To leverage real-time data in press and mold monitoring, industries must embrace advanced data acquisition and integration techniques that transform raw machine data into actionable insights.This entails employing sensors and data logger systems capable of capturing high-frequency data from critical points, such as press forces, mold temperatures, and cycle times.Integrating this data involves collecting it efficiently through Industrial Internet of Things (IIoT) gateways and connecting it seamlessly to an Ignition SCADA system. With an interoperable setup, data flows directly from machine-level PLCs to the central Ignition platform, enabling swift analysis and visualization. For example, edge devices can filter and preprocess data before it enters the network, effectively reducing bandwidth usage and ensuring the central system only deals with relevant, processed data.
Crafting real-time KPI dashboards requires a keen understanding of both technical setup and user needs, allowing operators to monitor essential metrics like production speed, scrap rates, and energy consumption. Use a structured approach to design intuitive interfaces with ignition’s Designer Tool focusing on multi-panel layouts were each panel represents critical KPIs in live view. Options for customization might include:
- Configurable alerting for anomalies in mold temperature variations or unexpected downtimes.
- Dynamic graphs that showcase trends over specified periods, providing both a macro and micro view of operational efficiency.
- Drill-down functionality that allows users to navigate through past data for root cause analysis of specific events or faults.
Such comprehensive dashboards not only enhance real-time monitoring but also empower teams to execute data-driven decisions,thereby facilitating clean-tech initiatives by minimizing waste and optimizing resource utilization.
Key Performance Indicators Essential for Press and Mold Efficiency
To optimize press and mold efficiency within the production environment, it is indeed crucial to monitor certain key performance indicators (KPIs) that provide real-time insights into operational effectiveness. These KPIs help identify bottlenecks and inefficiencies that could perhaps lead to downtime or increased production costs. Cycle time is a critical KPI as it determines how fast a single mold cycle can be completed; shorter cycles often translate to higher productivity. Similarly, downtime tracking is essential to understand the frequency and duration of production halts, providing direct insights into maintenance needs and operational hiccups. Scrap rate is another key metric, measuring the percentage of wasted material, thus aligning with clean tech initiatives to minimize environmental impact by reducing waste output and optimizing resource use. A rise in scrap rate is a clear indicator for reviewing mold setups and processes for potential adjustments.
Being able to track and analyze clamp force and temperature monitoring can further enhance mold performance. Variations in the clamp force can signal the need for mechanical adjustments or maintenance,while temperature changes can impact material consistency,leading to potential waste or rework. The use of predictive maintenance metrics, such as lubrication levels and component wear indicators, can preemptively signal the need for intervention before failures occur, aligning with sustainability goals by extending the lifespan of machinery parts. OEE (overall Equipment Efficiency) serves as a comprehensive index that aggregates availability, performance, and quality metrics into a single view which helps in not only identifying efficiency levels but also in setting benchmarks for continuous improvement within the press and mold operations.
Designing Intuitive Dashboard Interfaces for Effective Data Visualization
Designing a dashboard for effective data visualization involves balancing complexity with clarity and ensuring that users have swift access to crucial facts. In the context of real-time KPI dashboards for press and mold monitoring, intuitive design is basic. Focus should be on key performance indicators (KPIs) that reflect pressing issues like cycle time,downtime,and machine efficiency,which can be tracked continuously. Customization helps operators filter data relevant to specific roles, such as maintenance or quality assurance teams, fostering more targeted and effective decision-making. Leveraging colour coding and alert systems enhances readability and prompt actions. for instance, a simple green-yellow-red schema can signify operational health: green for normal, yellow for caution, and red for critical alerts. Integration with hardware sensors and analytic software provides real-time updates, ensuring the dashboard presents current data, not historical records.
consider employing widgets for drilling down into specific KPI categories. Such as, a widget displaying cycle time statistics could feature graphical representations like trend lines or bar charts, offering visual context at a glance. The use of icon-based navigation facilitates quick toggling between these widgets, focusing the user’s attention and optimizing their workflow. Security aspects must not be overlooked; role-based access control ensures sensitive data stays protected. Incorporating features such as drag-and-drop elements and responsive design interfaces reinforces usability across various devices,from desktop screens in the control room to tablets on the factory floor. Time-bound goals can be established and tracked within the dashboard, promoting a culture of continuous improvement and environmental accountability by identifying areas for operational efficiency and resource conservation.
Strategies for Implementing Proactive Maintenance and performance Optimization
Implementing proactive maintenance within press and mold operations hinges on the ability to consistently monitor performance metrics and identify early signs of potential wear or inefficiency. Real-time KPI dashboards provide a dynamic interface that aggregates various data streams from connected machinery into a cohesive, actionable view. As a notable example, operators can monitor temperatures, pressure levels, and cycle times, identifying any anomalies that deviate from the usual patterns. By utilizing such data, a typical response could involve dispatching a maintenance team to inspect and rectify issues before they lead to downtime, thus ensuring a seamless production flow. Moreover, these dashboards can be tailored with tools like Ignition to trigger alerts based on customized thresholds, guaranteeing that maintenance is not simply reactive but intelligently proactive.
Performance optimization is further supported by the ability to visualize historical data trends through these dashboards. Using this data, facilities can conduct root cause analyses and develop preventive strategies that address specific inefficiencies. As a notable example, a mold shop might notice increased energy consumption linked to a specific batch of operations. By integrating Ignition’s analytical tools, operators can drill down into specific timeframes, examining sensor readings and control settings to identify inefficiencies or technical issues. This level of insight allows decision-makers to refine production processes,optimize cycle times,and ultimately extend the lifespan of press and molds through precision-engineered documents tailored for sustainable operations.
In Summary
real-time KPI dashboards for press and mold monitoring serve as indispensable tools in advancing manufacturing precision, efficiency, and sustainability. By integrating technologies like ignition, manufacturers can gain immediate insights into operational metrics, allowing for timely interventions and strategic decision-making. Key takeaways include:
- Enhanced Operational Visibility: Real-time data visualization helps in rapidly identifying performance bottlenecks and opportunities for improvement.
- Improved Efficiency: Automating the monitoring process reduces downtime and enhances the overall throughput by optimizing machine utilization.
- Actionable Insights: KPIs related to pressure, temperature, and cycle time offer critical insights that drive quality and consistency.
By leveraging these insights, manufacturers can transition towards more sustainable practices, minimizing waste and energy consumption.We invite you to explore our tailored solutions with Innorobix, where advanced technology meets intuitive design, elevating your process monitoring capabilities. For a deeper dive into how our solutions can transform your operations, schedule a consultation or request a demo today. Let us partner with you in crafting a future that aligns operational excellence with sustainability goals.