In today’s fast-paced manufacturing landscape,teh ability to monitor,analyze,and make data-driven decisions is crucial for maintaining competitive advantage. High-performance dashboards serve as a critical tool for achieving these goals, offering real-time visibility and deeper insights into operational processes. Inductive Automation’s Ignition SCADA platform stands as a robust solution for creating such dashboards, enabling unparalleled versatility and customization.Whether you’re a seasoned plant manager or a budding industrial automation specialist, understanding how to leverage Ignition’s dynamic capabilities can significantly enhance your operational efficiencies.
In this comprehensive guide, we will delve into the strategic value of building high-performance dashboards using Ignition.We’ll explore the step-by-step process from conceptualization to deployment, focusing on avoiding common pitfalls and harnessing advanced features. Real-world examples will demonstrate how various manufacturers have transformed their operations with optimized dashboards,providing actionable insights and clarity.
Key Highlights Will Include:
- Data Source Integration: Discover how to seamlessly integrate various data sources using Ignition’s versatile connector options.
- Visualization Best Practices: Learn about the design principles that drive clearer, more insightful data representation.
- Real-Time Analytics: Understand how to leverage real-time data processing to generate actionable insights instantly.
- User Interactivity: Explore interactive components that empower end-users to customize their data views.
With insights from industry experts and years of hands-on experience, Innorobix equips you with the practical knowledge and skills necessary to create dashboards that are not only functional but transformative for your operation’s efficiency. Dive in as we unlock the full potential of Ignition SCADA, guiding you at every step to ensure your journey to high-performance dashboard creation is both insightful and rewarding.
Understanding Core Elements of High-Performance Dashboards in Ignition SCADA System
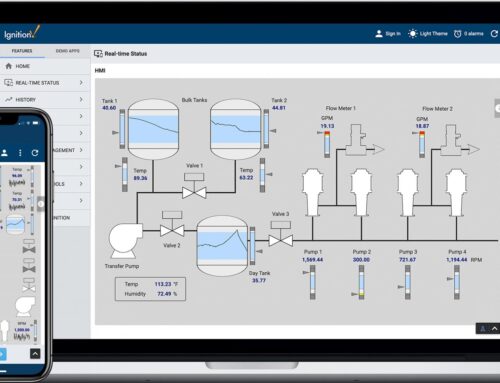
High-performance dashboards are essential in providing actionable insights and enhancing decision-making processes in industrial environments. At the core of these applications in the Ignition SCADA system are several key elements that ensure the efficiency and clarity of details delivery. To begin with, an effective dashboard must incorporate real-time data visualization. This means that all elements such as graphs, charts, and indicators should dynamically update to reflect current operational statuses. For instance, a manufacturing plant might utilize trend graphs to monitor temperature and pressure levels in real-time, allowing operators to swiftly identify and react to anomalies. Moreover, by employing intuitive interface designs, users can instantly grasp critical information without undergoing extensive training, ultimately optimizing response times and operational efficiency.
Another core aspect involves the customization and scalability of dashboard elements.Ignition’s modular design allows for the tailored configuration of dashboards to align with specific operational needs. Manufacturing facilities can,therefore,integrate widgets that are relevant to their processes such as KPI meters for production throughput or pie charts for resource allocation. Moreover, the scalability of the Ignition platform ensures that as a business grows, its dashboard solution can expand accordingly without necessitating complete redesigns. For exmaple, a plant manager at a beverage production company might start with basic production line metrics and later scale up to include maintenance schedules and supply chain logistics. Leveraging Ignition’s Python scripting and SQL database connectivity, users can build advanced calculations and integrate external data sources, achieving a comprehensive, high-performance solution that evolves with their business needs.
Optimizing Data Integration and Visualization Techniques for Real-Time Insights
High-performance dashboards crafted with Ignition SCADA provide unparalleled real-time insights by optimizing data integration and visualization. To ensure efficient data processing, leveraging Ignition’s robust tag structure is essential. By organizing extensive data sets through tag groups within the tag Browser, users can reduce server load and stream data more effectively across the network. This structured approach impacts dashboard responsiveness significantly, especially when dealing with IoT sensors and SCADA tags that require frequent updates. For example, many manufacturers integrate Ignition with their ERP systems by setting up historical tag groups that intelligently categorize and store data on intervals synced to operational periods, thereby enhancing both performance and relevancy of displayed data.
Onc the data is streamlined, applying advanced visualization techniques in Ignition Designer helps transform raw data into actionable intelligence. Utilize Ignition’s comprehensive library of components—such as the Power Chart, Sparkline, and Status Chart—to produce intuitive visual representations. Design dashboards that exhibit a clean user interface with strategic color coding and configurations to highlight critical metrics, like downtimes or production inefficiencies. For example, a plant manager at a beverage facility coudl track and react in real-time to changes in machinery status or throughput using a dynamic dashboard, improving decision-making processes and reducing downtime. Adopting these practices not only enriches the user experience but empowers plant personnel with real-time operational insights, driving informed decisions and boosting overall efficiency.
Advanced Configuration Settings for Enhanced User Experience and System Efficiency
To harness the full potential of Ignition SCADA for creating high-performance dashboards, it’s crucial to dive deep into advanced configuration settings. These settings allow you to tailor the user experience while optimizing system efficiency. start by leveraging Ignition’s powerful Database Query Browser. Such as, ensuring that SQL queries are optimized can dramatically reduce data retrieval times, especially when dealing with large volumes of historical data. consider using efficient indexing strategies and limiting data fetches to only necessary information for dashboard metrics. Additionally, employing Tag Historian effectively allows you to seamlessly store and query high-resolution data without impacting system performance. Configure your tag properties to balance granularity and storage costs, ensuring that dashboard updates remain swift and responsive, even during peak operations.
Another crucial aspect is session management and user role configuration. Set up sophisticated permission structures to ensure that users access only relevant data, enhancing both security and efficiency. For instance, plant managers might require comprehensive oversight capabilities, whereas line operators need simplified, task-specific interfaces. Utilize Ignition’s built-in security zones and role-based access control to segment these views effectively. Moreover, customize the look and feel of dashboards using CSS styling within Ignition; this goes beyond aesthetics by contributing to user efficiency through intuitive design language and visual hierarchy. Implement caching strategies and connection pooling to streamline interactions with external systems, reducing latency and ensuring that dashboard visuals keep pace with real-time operational data.
Best Practices for Maintaining and Updating Ignition Dashboards in Industrial Environments
Maintaining and updating Ignition dashboards effectively begins with a well-structured project organization.when setting up your dashboards in an industrial environment, it’s crucial to establish a modular architecture. Use templates and coordinate containers to reduce duplication and maintain consistency across various views.For instance, a large manufacturing plant might implement a centralized template for motor status indicators. When updates are necessary, such as implementing a new data point or altering visual elements, these changes can be cascaded through all instances derived from the template with minimal manual intervention, preserving both time and reducing errors. Additionally, adopting a version control system integrated with Ignition, like Git, allows teams to track changes and collaborate efficiently, ensuring any new updates are thoroughly vetted before deploying to production.
To ensure your Ignition dashboards are performing optimally, routine performance assessments should be scheduled. One effective method is to utilize Ignition’s built-in performance diagnostics to monitor client and gateway utilization, identifying potential bottlenecks. For example, you might discover through diagnostics that specific queries or scripts are consuming excessive resources, which could be streamlined for better performance. regularly engaging in these assessments not only highlights areas for enhancement but also ensures that dashboards continue to meet the dynamic needs of the industrial environment.Moreover,engaging with user feedback and conducting usability testing can further enhance dashboard efficacy,as real-world operator insights often reveal practical issues that technical diagnostics might overlook. Implementing these best practices not only maintains high performance but also empowers teams to innovate and respond to operational demands swiftly.
Q&A
Q&A: How to Build High-Performance Dashboards with Ignition SCADA
Q1: What are the critical components of a high-performance dashboard in Ignition?
A1: A high-performance dashboard in Ignition SCADA integrates several key components to display vital operational data effectively and efficiently:
- Data Sources: Ensure integration with various data sources such as PLCs, databases, and historians utilizing Ignition’s built-in OPC UA server and SQL Bridge module.
- Visualization Elements: Use charts, graphs, and tables to represent data clearly. Emphasize readability by selecting appropriate visualization styles for different data types.
- Real-Time data: Leverage Ignition’s real-time capabilities to update dashboard data dynamically, providing immediate insights into operations.
- User Customization: Allow users to customize views to prioritize the information that is most relevant to their roles.
- Performance and Scalability: Implement efficient querying and data handling practices to maintain performance as data volume increases.
Example: A manufacturing plant dashboard might include real-time production line status, historical performance trends, and alerts for equipment malfunction.
Q2: How can I optimize the performance of dashboards built using Ignition?
A2: Performance optimization is crucial for ensuring your dashboards run smoothly and responsively:
- Efficient Data Queries: utilize SQL querying best practices. Avoid heavy queries during peak load times that could slow down dashboard responsiveness.
- Scripting and Caching: Use Ignition’s scripting capabilities to pre-process data or cache results when appropriate to reduce load times.
- Controlled Refresh Rates: Set appropriate polling rates for real-time data refresh to balance performance with data update requirements.
- Use of Style and design: Simplify design elements to reduce rendering complexity. Optimize images and graphics for quick loading.
Q3: What are common pitfalls when deploying Ignition dashboards and how can they be avoided?
A3: Several common pitfalls can be avoided with proactive planning and strategy:
- Inadequate Needs Assessment: Failing to fully understand operational requirements leads to dashboards that do not effectively support decision-making. Conduct thorough needs assessments before design.
- Poor Data Quality: Dashboards reflect the quality of their data. Implement data validation processes to ensure accuracy and reliability in displayed information.
- Overcomplicated Visualization: While it can be tempting to display all available data,simplicity is key. Focus on critical indicators and avoid clutter.
- Insufficient User Training: Ensure end-users are fully trained on dashboard functionality to maximize utility and minimize misinterpretations.
Q4: Can Ignition dashboards be accessed remotely and securely?
A4: Yes, Ignition supports remote access, allowing users to monitor operations globally through secure connections:
- Web-based Interfaces: Ignition dashboards can be accessed via web browsers, facilitating cross-platform accessibility without the need for additional software.
- Security Protocols: Implement HTTPS, VPNs, and role-based access control to secure dashboard data against unauthorized access.
- Mobile Device Access: Use Ignition Outlook module to build mobile-friendly dashboards, supporting on-the-go insights for field operators.
By understanding these elements and considerations, manufacturers and plant managers can effectively leverage Ignition to build powerful dashboards that drive operational efficiency and strategic decision-making. For further guidance, Innorobix’s team of specialists, with decades of Ignition deployment experience, is ready to assist with your SCADA projects.
Wrapping Up
building high-performance dashboards with Ignition SCADA can significantly enhance operational visibility and efficiency across your manufacturing processes. Key takeaways from this article include:
- Strategic Planning: Assess your specific data visualization needs to ensure your dashboard aligns with business goals and operational requirements.
- Design Principles: Apply principles of user-friendly design to create intuitive and clutter-free dashboards that enhance user engagement and decision-making.
- Advanced Features Utilization: Leverage Ignition’s robust features, such as real-time data connectivity and custom scripting, to create dynamic and interactive dashboards that deliver actionable insights.
- Performance Optimization: Implement best practices in data architecture and resource management to achieve optimal dashboard performance and scalability.
Real-world examples have demonstrated how manufacturers can use Ignition to streamline operations and facilitate a more proactive approach to process management. By addressing the common deployment pitfalls and focusing on continuous improvement, your organization can fully capitalize on the benefits offered by high-performance dashboards.At Innorobix, our team of certified Ignition experts is dedicated to helping you unlock the full potential of your SCADA solutions.Whether you’re looking to enhance existing systems or explore new opportunities with Ignition, we invite you to reach out for a personalized consultation or presentation. Contact us today to start transforming your data into actionable insights that drive success.