Introduction to Past Trending for Cycle time Deviations
In today’s fast-paced industrial landscape, understanding and optimizing manufacturing efficiency is paramount. One critical aspect of this endeavor is the analysis of cycle time deviations. Cycle time, the total time from the beginning to the end of a process, directly impacts production efficiency and product quality. Deviations from the expected cycle time can lead to bottlenecks,increased operational costs,and diminished product quality,all of which jeopardize competitiveness and profitability.
To address this, manufacturers are increasingly turning to historical trending, a data-driven approach that enables the identification, analysis, and mitigation of cycle time deviations. This approach leverages historical production data to illuminate patterns and deviations that might or else go unnoticed.
This article will explore:
- Definition and Importance of Cycle Time:
Understanding the basics of cycle time and its essential role in the production process.
- Factors Leading to Deviations:
Identifying key contributors such as equipment malfunctions, workforce inefficiencies, raw material variability, and process design.
- Leveraging Historical Data:
Utilizing advanced data analytics and historical data to pinpoint systemic issues and anomalies in cycle time.
- Implementing Historical Trending:
Practical steps for deploying historical trending within industrial systems using modern software solutions, including setting up data collection and trending visualization.
- Case Studies and Real-World Applications:
Examples of industries that successfully reduced cycle time deviations through the application of historical trending.
- future Trends and Innovations:
Exploring emerging technologies such as AI and machine learning and their potential to further refine the process of historical trending for cycle time analysis.
This authoritative guide is aimed at manufacturing professionals seeking to enhance operational efficiency and product quality through the strategic analysis of cycle time deviations. By understanding the intricacies of historical trending,readers will be equipped with the insights necessary to drive ample improvements in their production processes.
Understanding Cycle Time Variability: Key Metrics and Causes
Cycle time variability in manufacturing processes significantly impacts efficiency and product consistency. Key metrics for analyzing these deviations include average cycle time, standard deviation, and coefficient of variation. Understanding these indicators helps in pinpointing exactly where deviations occur and assessing the frequency of their occurrence. For instance, a sudden spike in the standard deviation could indicate a process anomaly or varying input material quality. Using these metrics enables manufacturing managers to make data-driven decisions, mitigate risks, and optimize process stability. Historical data trending allows for the identification of patterns, helping organizations anticipate and proactively address potential issues.
Several root causes can contribute to cycle time variability, each requiring a different approach for resolution.Some common culprits include:
- Machine or Tool Wear and Tear: Over time, aging equipment can lead to inefficiencies in the process.
example: A slight misalignment in an injection mold tool can cause extra time for part ejection, affecting cycle time. - Variability in Raw Materials: Differences in the composition or quality of raw materials can lead to longer processing times.
Example: A batch of raw plastic pellets with higher moisture content may lead to slower drying time. - Operator Inconsistencies: Variance in operator skills or training can affect how efficiently the cycle runs.
Example: A new operator may not adjust settings as precisely, leading to longer cycle times.
By understanding these causes and monitoring the associated metrics, manufacturers can implement strategic improvements and harness technology for real-time adjustments, ensuring more consistent production cycles.
Advanced Data Analytics for Detecting Anomalies in Cycle Times
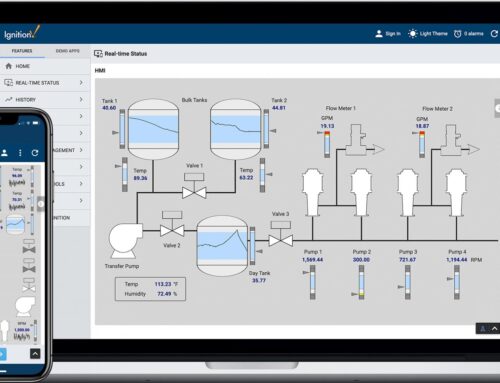
In the realm of advanced manufacturing, maintaining consistent cycle times is pivotal for optimizing production schedules and minimizing inefficiencies. By leveraging advanced data analytics within a robust SCADA platform, manufacturers can significantly enhance their ability to detect and address anomalies in cycle times, which are crucial for maintaining optimal operational efficiency. A historical trending analysis provides insights into past performance, enabling the identification of patterns or deviations that may indicate underlying mechanical issues or inefficiencies in the production process. As an example, in an injection molding operation, a sudden deviation from the average cycle time could be indicative of issues with mold temperature, hydraulic pressure discrepancies, or even material inconsistency. These insights allow for preventative measures to be implemented before a minor divergence in cycle time escalates into a production bottleneck.
- Real-time Monitoring: advanced analytics tools within platforms like Ignition enable real-time monitoring of cycle times, providing operators with instantaneous feedback on process variations.
- Automated Alerts: When coupled with machine learning algorithms, these tools can be programmed to trigger alerts when cycle times deviate beyond predefined thresholds, alerting maintenance teams to potential issues.
- Predictive Maintenance: Historical data trends can feed predictive maintenance models,anticipating when machines will require servicing based on identified anomalies in cycle times.
- Case Study: Consider a plastic extrusion company that implemented historical trending to track cycle time variations. By analyzing deviations with ignition’s analytics module, they were able to reduce unplanned downtime by 30% and increase their overall throughput by 15% within six months, ultimately leading to a more sustainable operation with reduced energy consumption and waste.
Implementing Predictive Tools to Minimize Cycle Time Deviations
Utilizing predictive tools within a manufacturing environment empowers facilities to meticulously monitor, evaluate, and adjust cycle times, ensuring they remain within optimal ranges. By leveraging ignition’s robust historical data capabilities, manufacturers can dive deep into cycle time data for each production batch, identifying patterns and deviations that could potentially signal inefficiencies. Implementing these tools allows for comprehensive data collection across various PLC-controlled machines, which can be cohesively analyzed to predict future cycle time discrepancies. As an example, by examining regular production intervals, manufacturers can preemptively spot machinery that may require maintenance, thus avoiding unplanned downtimes. The result is a streamlined production process that minimizes waste, enhances throughput, and significantly reduces energy consumption, contributing to a more sustainable operational flow.
Beyond just monitoring current cycle times, predictive tools facilitate actionable insights through real-time alerts and analytics.Advanced algorithms can be set up within Ignition to analyze historical patterns and predict potential cycle time deviations before they occur. This is notably crucial in operations such as injection molding, where even minor deviations can lead to defects, increased scrap rates, and material wastage. A real-world example includes setting up a dashboard that tracks and displays cycle time deviations over months, enabling operators to execute preventive maintenance or calibrations with precision. Moreover,by pinpointing specific stages in the production cycle prone to deviations,production managers can implement targeted interventions,thereby optimizing the overall production process and contributing to a more sustainable and efficient manufacturing workflow.
Best Practices for Continuous Improvement in Manufacturing Efficiency
In embracing historical trending for cycle time deviations, its essential for manufacturers to implement best practices that foster continuous improvement and pinpoint bottlenecks within their processes. By harnessing the power of data analytics, factories can retrospectively evaluate their production cycles, identifying inconsistencies and unexpected peaks or troughs in cycle times.For instance, analyze a sudden spike in injection molding cycle times over the past quarter. Was there machinery wear, a material supply issue, or perhaps an anomaly in the PLC programming? Such insights allow intervention by adjusting maintenance schedules or sourcing higher quality materials—all directly informed by historical trends. This data-driven approach is not just reactive but proactively sustains efficiency by advocating a culture of constant vigilance toward operational excellence.
Integrating these best practices into a strategic operations framework involves several critical steps. start by fully automating data collection using IoT-enabled sensors on manufacturing equipment, ensuring all cycle time deviations are recorded and easily accessible. For instance, compile this data into dashboards using software like Ignition by Inductive Automation, offering real-time visibility and historical analytics. Next, interpret the data collaboratively with cross-functional teams—engineering, maintenance, and operations—facilitating discussions on causal factors and the growth of corrective actions. Lastly, leverage this intelligence to inform continuous training efforts, instilling a mindset of agility and improvement across the workforce. Such practices not only enhance manufacturing efficiency but also contribute to a more sustainable, resource-conscious operation, reducing waste and lowering energy consumption as direct benefits.
Key Takeaways
effectively managing and analyzing historical trending for cycle time deviations is pivotal to optimizing manufacturing processes. By leveraging advanced data analytics and real-time monitoring systems, manufacturers can gain profound insights into cycle time variations, identify root causes, and implement corrective measures proactively. Key takeaways from this exploration include:
– The significance of historical data in predicting and mitigating cycle time deviations.
– The role of automated monitoring systems in enhancing process efficiency and minimizing downtime.
– Practical applications of cycle time analysis in reducing waste and increasing overall productivity.
As manufacturing processes become increasingly complex, the need for precise and actionable insights is greater than ever. At Innorobix, we specialize in delivering cutting-edge solutions tailored to meet these evolving challenges. We invite you to explore our comprehensive suite of automation tools, or request a personalized consultation/demo to see how we can empower yoru operations. Partner with us to pave the way for smarter manufacturing through innovative technology.