Introduction: Using SCADA Dashboards too Visualize Energy Savings Post Retrofit
As industries strive to enhance operational efficiency adn sustainability, a significant number have turned their attention to energy retrofits as a means of reducing consumption and lowering costs. However, teh true impact of these retrofits can often remain obscured without the right tools for analysis and visualization. this is where SCADA (Supervisory Control and Data Acquisition) dashboards come into play, providing real-time insights that enable organizations to effectively monitor and quantify energy savings.
Leveraging SCADA dashboards post-retrofit facilitates a comprehensive understanding of energy performance, offering immediate access to a wealth of relevant data. These digital interfaces bridge the gap between raw operational data and actionable insights, empowering facility managers and engineers to make informed decisions based on visualized metrics.
Key Benefits of SCADA Dashboards for Energy Savings Visualization:
- Real-Time Monitoring: Instantaneous data collection allows for continuous tracking of energy usage before and after retrofitting.
- Data Visualization: Graphical representations of energy consumption patterns make trend analysis straightforward, revealing potential areas for further enhancement.
- Performance Benchmarking: Set benchmarks based on pre-retrofit conditions to measure the effectiveness and ROI of energy-saving initiatives.
- Anomaly Detection: Alarms and alerts can be configured to identify deviations from expected energy consumption, signaling possible inefficiencies or equipment issues.
- Reporting Capabilities: Generate automated reports that summarize energy performance metrics over specified periods, enhancing transparency and stakeholder engagement.
Example Applications:
- Manufacturing Facilities: Organizations can compare energy usage metrics pre-and post-retrofit to track efficiency gains in machinery like HVAC systems or motors.
- Water Treatment Plants: SCADA can help visualize energy trends related to pump operation and operational schedules, allowing for the identification of peak usage times and potential cost-saving adjustments.
- Commercial Buildings: Dashboard data can show energy savings achieved thru lighting and HVAC upgrades, facilitating efforts to reach sustainability goals.
In this article, we will explore the profound impacts that SCADA dashboards have in enabling organizations to not only realise but also visualize energy savings after implementing retrofits. Through detailed examples and best practices, we aim to illuminate how these tools are essential for achieving efficiency, sustainability, and long-term financial viability in energy management.
Understanding the Energy Consumption Baseline for Effective Retrofit Analysis
To achieve effective retrofit analysis, establishing a clear energy consumption baseline is crucial. This baseline serves as a reference point against which the energy savings from retrofitting can be measured. To develop this baseline, it is pivotal to monitor energy usage data over a substantial period, ideally including seasonal variations, production schedules, and operational conditions.Utilizing SCADA (Supervisory Control and Data Acquisition) dashboards enables real-time visualization and tracking of energy consumption across various components of your facility. Such as, a manufacturing plant that retrofitted its lighting system can analyze past data to assess how the energy usage has changed based on the new LED fixtures compared to the previous incandescent bulbs. This comparative analysis not only identifies energy savings but also helps justify the investment made in the retrofit for stakeholders and management.
Effective monitoring requires factoring in variables that can influence energy consumption, such as changes in production volume, shifts in operational efficiency, and maintenance schedules. Implementing advanced analytics tools within SCADA systems allows you to visualize these variables dynamically. Companies have seen significant improvements by integrating sensors that provide real-time feedback and alerts on equipment performance, facilitating prompt action and eliminating energy waste. When developing your baseline, consider the following aspects:
- Historical Energy Data: Gather at least a year of energy consumption records to account for variations.
- Baseline Metrics: Use metrics like kWh per unit of production to establish a clear, actionable baseline.
- Seasonal Adjustments: ensure that your analysis considers variations in energy needs due to seasonal changes.
This comprehensive approach leads to more accurate evaluation post-retrofit,ensuring that the data visualized in SCADA dashboards can translate into actionable energy savings and improved operational efficiency.
Leveraging SCADA Dashboards for Real-Time Energy Monitoring and visualization
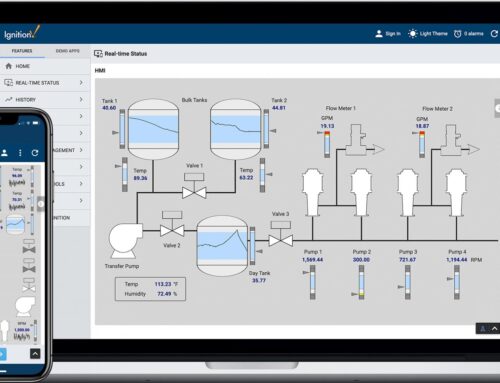
SCADA dashboards serve as a powerful tool for monitoring energy consumption in real-time, especially after retrofitting energy systems in manufacturing plants or industrial facilities. These dashboards can be customized to reflect crucial energy metrics, allowing operators to visualize energy usage patterns and identify potential areas for savings. For example,after a factory retrofitted its lighting system from conventional bulbs to LED technology,the SCADA system was configured to track energy usage before and after the retrofit. The dashboard displayed the real-time energy consumption data in a clear, engaging format, highlighting a marked decrease in energy use during peak hours. This allowed facility managers to directly correlate retrofit implementations with energy savings and cost reductions.
Furthermore, with the integration of real-time alerts, plant operators can promptly respond to anomalies in energy consumption. For instance, if the SCADA system detects an unexpected spike in energy usage from a specific machine, operators receive immediate notifications through the dashboard. This feature minimizes downtime and enhances operational efficiency by enabling proactive measures. Key performance indicators (KPIs) displayed on the dashboard can include metrics such as kWh used per production unit, hours of operation, and maintenance intervals. By visualizing data in such an intuitive way, decision-makers can implement informed strategies to further optimize energy consumption, sustain long-term savings, and contribute to environmental initiatives.
Implementing Key Performance Indicators to Measure Retrofit Success
Implementing key performance indicators (KPIs) is essential in evaluating the success of retrofitting efforts. As an example, a facility that has replaced its old HVAC system with a more energy-efficient model should track several specific KPIs to measure the impact. These may include energy consumption per square foot, cost savings from reduced energy bills, and maintenance costs associated with the older and newer systems. Real-world examples like a manufacturing plant that reduced its energy use by 30% post-retrofit not only quantify savings but also serve as benchmarks for future projects.
In addition to energy metrics, it is significant to incorporate operational KPIs that can give a more comprehensive view of the retrofit’s effectiveness. Consider metrics such as system uptime, production output, and downtime incidents related to the newly installed systems. For a recycling facility, implementing SCADA dashboards can enable real-time monitoring of these KPIs, facilitating quick responses to inefficiencies. For example, a sorting system that sees improved uptime and output flow post-retrofit can directly correlate to energy savings, allowing operators to showcase these benefits in both operational and sustainability reports.
Strategies for Continuous Improvement and Future Energy Savings Through SCADA Insights
The implementation of SCADA dashboards not only facilitates real-time energy monitoring but also fosters a culture of continuous improvement by enabling data-driven decisions.With real-time insights, facilities can analyze energy consumption patterns post-retrofit to identify inefficiencies and areas for further enhancement. for example,a major plastics recycling facility that upgraded its granulators reported a 20% reduction in energy usage after employing SCADA analytics to fine-tune machine operations.Using operator dashboards, personnel can visualize KPIs such as energy consumption per ton, output rates, and machine uptime, allowing them to make instantaneous adjustments based on real-time data, thus minimizing energy waste and escalating efficiency.
Moreover, these insights drive proactive maintenance strategies. Historical data on machine performance can reveal trends that indicate potential failures, enabling preemptive actions that not only save energy but also reduce downtime. As an example, an automated sorting system implementing SCADA-generated alerts for temperature anomalies resulted in identifying 80% of potential equipment failures before they occurred, translating into significant energy savings and optimized operational efficiency. Emphasizing opportunities for staff training based on SCADA findings further amplifies these benefits; training sessions focused on energy-saving operations can equip operators with the knowledge to adjust machinery for optimal performance. In essence, harnessing SCADA insights for continuous improvement creates a virtuous cycle of energy savings, improved performance, and enhanced environmental compliance.
Future Outlook
harnessing SCADA dashboards to visualize energy savings post-retrofit is not just a best practice; it is a strategic move for optimizing operational efficiency and sustainability. By implementing an advanced SCADA system, organizations can achieve:
- Real-time data visualization: Monitor energy consumption patterns and savings directly from intuitive dashboards.
- Enhanced decision-making: Utilize metrics and trends to make informed choices regarding energy management strategies.
- Proactive maintenance alerts: Identify anomalies in energy usage, leading to timely interventions that further optimize savings.
- Comprehensive reporting: Generate detailed reports for stakeholders to ensure transparency and track progress against sustainability goals.
We encourage you to explore innovative solutions with Innorobix, where our expertise in integrating cutting-edge SCADA technologies can help you maximize your energy savings and improve overall plant performance. For personalized insights, consider requesting a consultation or demo with our team to discuss tailored solutions that meet your specific needs. Let’s work together toward a lasting and energy-efficient future.