Introduction: Visualizing Cycle Times by Operator, Job, and Machine
In today’s highly competitive manufacturing landscape, optimizing the efficiency and productivity of shop floor operations is paramount.One of the most effective ways to achieve this optimization is by visualizing and analyzing cycle times across different dimensions such as operator, job, and machine. Understanding the intricacies of cycle time data empowers manufacturers to identify bottlenecks, improve process flows, and enhance overall production efficiency. This article delves into the importance of cycle time visualization, offering insights into how manufacturers can harness this data to drive notable improvements.
Why Visualize Cycle Times?
- Operational Transparency: By visualizing cycle times, manufacturers gain a extensive view of their operations. This transparency allows for pinpointing inefficiencies and implementing targeted improvements.
- Performance Benchmarking: Cycle time data enables companies to benchmark performance across operators, jobs, and machines, providing a clear picture of where improvements are most needed.
- continuous Improvement: Visualization tools facilitate ongoing monitoring and analysis,fostering a culture of continuous improvement by enabling proactive identification and resolution of issues.
Key considerations in Cycle Time Visualization
- Data Sources: Integrating data from multiple sources—for instance, machine analytics, ERP systems, and MES software—ensures a holistic view of cycle times and their influencing factors.
- Granularity: Visualizations can be tailored to different levels of detail, from broad overviews of entire shifts or production runs to granular insights into individual processes.
- Real-time Monitoring: Implementing real-time cycle time monitoring allows for immediate corrective actions, minimizing downtime and enhancing adaptability.
Examples of Visualization Tools and Techniques
- Dashboards: Interactive dashboards provide a visual depiction of cycle time data, enabling swift insights and easy identification of trends and outliers.
- Heat Maps: utilize heat maps to identify patterns and anomalies in cycle times across different operators, shifts, or production lines.
- Trend Analysis: Graphical trend analyses offer a longitudinal view of cycle times, highlighting improvements over time and identifying persistent challenges.
By seamlessly integrating visualization tools with existing shop floor systems, manufacturers can substantially enhance their ability to manage and optimize production processes. The insights gained from visualizing cycle times by operator, job, and machine form a foundation for data-driven decision-making and strategic planning, ultimately driving substantial gains in productivity and profitability. As we explore deeper into cycle time visualization, we’ll outline the technical methodology and illustrate with real-world examples how these techniques can transform shop floor operations.
Understanding the Fundamentals of Cycle Time analysis for Enhanced Efficiency
In the intricate world of manufacturing, cycle time analysis becomes more than just a numeric representation of how long it takes to complete a unit of production. It serves as a window into the efficiency of operations, revealing the hidden tendencies and opportunities for improvement. By leveraging tools such as the Innorobix MTConnect module, manufacturers can gain valuable insights by visualizing cycle times in relation to specific operators, machines, and jobs. Imagine a scenario where two seemingly identical CNC machines have different cycle times when operated by different staff members. Accessing and analyzing this data allows you to identify variances in technique or equipment performance, offering concrete evidence for targeted training sessions, optimized work scheduling, and timely maintenance interventions.
- Operator Analysis: Recognizing the variations in cycle times among operators can help identify training needs and boost productivity across shifts.
- Job Tracking: Detailed insights into how specific jobs affect cycle time can unveil bottlenecks due to complex part geometries or specific client requirements.
- Machine Performance: By detecting fluctuating cycle times with specific machines through real-time data,preemptive maintenance can be scheduled before issues lead to downtime.
Real-world applications highlight the importance of precise data collection and visualization. For instance, a manufacturer using the Innorobix module reduced their average cycle time by 15% over three months by analyzing differences among operators, identifying an underperforming spindle, and reallocating resources to bolster high-demand shifts. By realigning these cycle time components with business objectives, companies can redefine their production strategy and achieve significant return on investment, turning abstract data analysis into substantial productivity gains.
Leveraging Advanced Visualization Tools to Correlate Cycle Times with Operator Performance
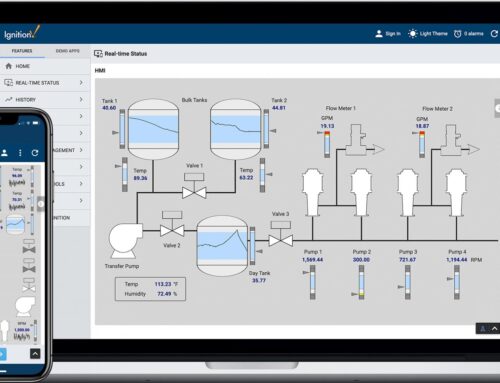
In the dynamic surroundings of manufacturing, correlating cycle times with operator performance can unearth valuable insights that drive productivity. Utilizing advanced visualization tools like those integrated in the Ignition platform, powered by the Innorobix MTConnect module, allows shop managers to achieve this correlation with greater precision. Visual dashboards present real-time data, mapping cycle times against operators, jobs, and specific machines. This data is seamlessly extracted from CNC machines using MTConnect and processed through MES systems for analysis. Imagine a bottleneck where a specific machine consistently shows longer cycle times. By drilling down into the visualization,managers may discover that during shifts with Operator A,the cycle time is notably longer compared to other operators. Such insights can lead to tailored training or adjustments in operator assignments,effectively optimizing the shop floor’s human resources.
By employing these visualization tools, managers can not only identify trends in production data but also pinpoint areas for improvement at a granular level. For example, suppose a job consistently exceeds its allotted cycle time when processed by the same operator across different machines. This discovery indicates a potential skills gap that, once addressed, could substantially reduce cycle times and increase throughput. Moreover, visualizations can be used to perform a comparative analysis across shifts, identifying discrepancies in efficiency related to human factors rather than machine performance. Such rich, actionable insights emphasize the power of integrating automation and data analytics, turning raw data into targeted strategies for enhancing operational efficiency and return on investment.
Optimizing Machine Utilization through Detailed Cycle time Breakdown by Job and Machine
Breaking down cycle times with precision can significantly enhance machine utilization on the shop floor. By leveraging the Innorobix MTConnect module integrated with Ignition’s MES, manufacturers gain insights into cycle time variations across multiple dimensions, such as individual operators, specific jobs, and distinct machines. This detailed breakdown allows for the identification of bottlenecks and opportunities for process improvements. For example, you might notice that the average cycle time for CNC Machine A is notably higher when managed by Operator Y, pointing towards a need for targeted training or an inquiry into equipment setup procedures. By identifying these trends, shops can allocate resources more efficiently, improve training programs, and ensure that machines are running at their optimal potential.
Through this detailed level of data analysis, manufacturers can transform their production lines using actionable insights derived from real-time data. Consider a scenario where Job 452 consistently takes longer on Machine X compared to similar machines; this anomaly might indicate underlying issues such as machine wear or software inefficiencies. By tapping into these insights, the operations team can preemptively address issues, minimizing downtime and increasing overall equipment effectiveness (OEE). With these detailed cycle time breakdowns, manufacturers not only enhance operational efficiency but also drive significant improvements in Return on Investment (ROI), demonstrating the critical value of data-driven decision-making in modern manufacturing environments.
Actionable strategies for Reducing Cycle Times Using Real-Time analytics and Operator Insights
Utilizing real-time analytics to optimize cycle times involves an clever combination of advanced technology and human insights. With Ignition and MES systems integrated into your production line, you can gather key data points that identify inefficiencies and areas for improvement. An intuitive dashboard view allows you to visualize cycle times by operator, job, and machine. For example, by integrating the Innorobix MTConnect module with your existing systems, you can aggregate data collected from machine sensors in real time. This data can highlight trends such as prolonged cycle times on certain jobs or inconsistency in operator performance. An operator might consistently finish jobs faster than others, indicating the need for a process review or additional training for some staff.
Real-world applications of this approach can generate substantial improvements in operational efficiency. As a notable example, one manufacturing facility analyzed their cycle times using this integrated data setup and realized significant discrepancies in performance between shifts. By pinpointing these variances,they were able to implement targeted operator training and adjust the machining environment leading to a 30% reduction in overall cycle times. Key strategies include:
- Automated Alerts: set up alerts that notify operators and supervisors in real time about deviations from expected cycle times.
- Data-Driven Insights: Use the captured data to perform root cause analysis, validating whether discrepancies stem from operator error, machine wear, or process bottlenecks.
- Continuous Improvement: Incorporate operator feedback to continually refine processes and ensure that the technology complements human skill.
This comprehensive approach not only reduces cycle times but fosters a culture of continuous improvement and operational excellence.
The Way Forward
visualizing cycle times by operator, job, and machine is a transformative strategy for enhancing operational efficiency and productivity on the shop floor. By integrating tools such as MTConnect, MES systems, and advanced data analytics platforms like Innorobix, manufacturers can achieve unprecedented insights into their operations. key takeaways include:
- In-depth visibility: understanding variability in cycle times allows for targeted improvements, elevating your facility’s overall efficiency.
- Bottleneck Identification: Pinpointing precise areas of delay facilitates proactive measures, reducing downtime and maximizing throughput.
- Performance Tracking: Operator performance insights foster a culture of continuous improvement and skill development.
We invite you to explore how Innorobix’s solutions can seamlessly integrate into your current system, offering a robust framework for shop floor optimization. Request a consultation or demo to discover how our innovative MTConnect module can transform your data into actionable intelligence, paving the way for a streamlined and profitable manufacturing process.